
Our Latest Articles
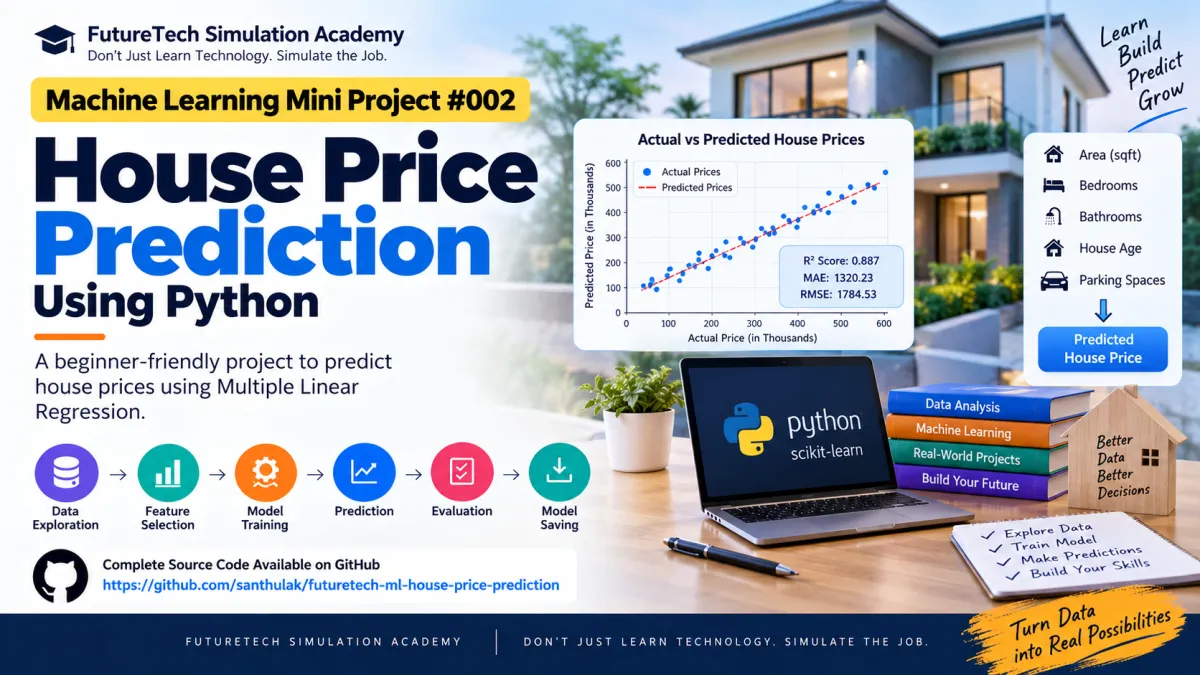
Machine Learning Mini Project #002: House Price Prediction Using Python
Welcome to Project #002 of the FutureTech Simulation Machine Learning Mini-Project Series.
In the previous project, we built a Student Score Prediction system using Linear Regression, where a single feature was used to predict a student's score.
In this project, we take the next step.
Instead of predicting a value using just one feature, we will use multiple property-related features to predict the estimated price of a house.
The project uses Python, Pandas, Matplotlib, and Scikit-learn to build a Multiple Linear Regression model.
The complete source code, dataset, trained model, notebook, and output files are available on GitHub:
https://github.com/santhulak/futuretech-ml-house-price-prediction
You can read the project on GitHub and download the complete source code and project files from there.
Project Overview
Imagine that a real estate company wants to build a basic system that can estimate the price of a house.
A house price can depend on several factors, such as:
• Area of the house
• Number of bedrooms
• Number of bathrooms
• Age of the property
• Number of parking spaces
Instead of manually calculating a price, we can train a Machine Learning model using historical examples.
The model learns relationships between property features and house prices.
Once trained, we can provide information about a new house and ask the model to estimate its price.
This is a classic supervised Machine Learning regression problem.
What Will You Build?
In this project, you will build a House Price Prediction System.
The system will:
• Load a house price dataset
• Explore the available data
• Select relevant features
• Separate features and target values
• Split the dataset into training and testing data
• Train a Multiple Linear Regression model
• Make predictions
• Evaluate the model
• Visualize actual versus predicted prices
• Save the trained Machine Learning model
• Use the model to predict the price of a new house
Machine Learning Concept Used
The main algorithm used in this project is Multiple Linear Regression.
Linear Regression is a supervised learning algorithm used for predicting continuous numerical values.
Scikit-learn's LinearRegression implements ordinary least squares regression and learns coefficients for the input features.
For a single feature, the basic idea can be represented as:
Predicted Value = Intercept + Coefficient × Feature
When multiple features are involved, the model becomes:
Predicted Price = Intercept + Coefficient₁ × Area + Coefficient₂ × Bedrooms + Coefficient₃ × Bathrooms + Coefficient₄ × House Age + Coefficient₅ × Parking Spaces
The model learns these coefficients from the training data.
Why Multiple Linear Regression?
A house price usually depends on more than one factor.
For example, consider two houses with the same area.
House A may have:
3 bedrooms
2 bathrooms
2 parking spaces
5 years old
House B may have:
3 bedrooms
2 bathrooms
1 parking space
20 years old
Although their areas may be similar, their estimated prices could be different.
This is why using multiple features can provide a more useful prediction than relying on a single feature.
Multiple Linear Regression allows the model to consider several numerical variables simultaneously.
Project Details
Project Number: #002
Project Name: House Price Prediction Using Python
Machine Learning Type: Supervised Learning
Problem Type: Regression
Algorithm: Multiple Linear Regression
Programming Language: Python
Dataset: Educational synthetic dataset
Libraries: Pandas, NumPy, Matplotlib, Scikit-learn, Joblib
Level: Beginner
Repository:
https://github.com/santhulak/futuretech-ml-house-price-prediction
Important Note About the Dataset
This project uses a synthetic educational dataset created specifically for learning Machine Learning concepts.
It is not a real estate valuation system and should not be used to determine actual market property prices.
Real-world property valuation would require much larger and more representative datasets, location information, market conditions, property type, neighborhood characteristics, transaction history, and many other factors.
Dataset Features
The dataset contains the following input features.
Area_sqft
The approximate area of the house in square feet.
Example:
1200
1500
1800
2200
Bedrooms
The number of bedrooms in the property.
Example:
2
3
4
Bathrooms
The number of bathrooms.
Example:
1
2
3
House_Age_Years
The approximate age of the property in years.
Example:
2
8
15
25
Parking_Spaces
The number of parking spaces available.
Example:
0
1
2
Target Variable
The target variable is:
Price_Thousands
This represents the house price in thousands of currency units in the educational dataset.
For example, a value of 250 represents 250 thousand currency units within this project's dataset.
Example Dataset Structure
A simplified example of the dataset looks like this:
Area_sqft | Bedrooms | Bathrooms | House_Age_Years | Parking_Spaces | Price_Thousands
1200 | 2 | 1 | 10 | 1 | 180
1500 | 3 | 2 | 8 | 1 | 250
1800 | 3 | 2 | 5 | 2 | 320
2200 | 4 | 3 | 4 | 2 | 430
Understanding Features and Target
Machine Learning models generally work with two important components.
Features:
The input variables used by the model.
In this project:
Area_sqft
Bedrooms
Bathrooms
House_Age_Years
Parking_Spaces
Target:
The value that we want the model to predict.
In this project:
Price_Thousands
Project Workflow
The complete Machine Learning workflow can be understood as:
Dataset
↓
Data Exploration
↓
Feature Selection
↓
Target Selection
↓
Train/Test Split
↓
Model Training
↓
Prediction
↓
Model Evaluation
↓
Visualization
↓
Model Saving
↓
New House Prediction
Step 1 — Load the Dataset
The first step is to load the house price dataset using Pandas.
The program reads:
data/house_prices.csv
Pandas makes it easy to inspect, clean, filter, and prepare tabular data for Machine Learning.
After loading the dataset, we can inspect the first few records and understand the available columns.
Step 2 — Explore the Dataset
Before training a Machine Learning model, it is important to understand the data.
Useful checks include:
Number of rows
Number of columns
Column names
Data types
Missing values
Basic statistics
Potential outliers
This stage is called Exploratory Data Analysis, or EDA.
EDA helps us understand whether the dataset is suitable for modeling.
Step 3 — Select the Features
The model uses five features:
Area_sqft
Bedrooms
Bathrooms
House_Age_Years
Parking_Spaces
These features are stored in X.
The target variable Price_Thousands is stored in y.
Conceptually:
X = input features
y = target value
Step 4 — Split the Dataset
The dataset is divided into two parts:
Training data
Testing data
The training dataset is used to teach the model.
The testing dataset is used to evaluate how well the trained model performs on data that it did not see during training.
In this project, we use an 80/20 split.
Approximately:
80% → Training data
20% → Testing data
This is an important Machine Learning practice because evaluating only on training data can give an overly optimistic view of model performance.
Step 5 — Create the Machine Learning Model
The project uses:
LinearRegression()
from Scikit-learn.
The model learns a mathematical relationship between the five input features and the target house price.
Scikit-learn describes LinearRegression as an ordinary least-squares linear regression estimator.
Step 6 — Train the Model
The model is trained using the training dataset.
Conceptually:
model.fit(X_train, y_train)
During training, the algorithm estimates coefficients that minimize the residual sum of squares between observed and predicted target values.
The model is essentially trying to learn:
How much does area influence price?
How does the number of bedrooms relate to price?
How does the number of bathrooms relate to price?
Does property age affect the prediction?
Does parking availability contribute to the predicted price?
Step 7 — Make Predictions
After training, we use the test dataset to generate predictions.
The model receives property characteristics and produces an estimated price.
For example:
Area = 1800 sq ft
Bedrooms = 3
Bathrooms = 2
House Age = 8 years
Parking Spaces = 1
The model uses all five values together to estimate the house price.
Step 8 — Evaluate the Model
Building a model is only the beginning.
We also need to determine how well the model performs.
This project calculates:
MAE
MSE
RMSE
R² Score
Mean Absolute Error — MAE
MAE measures the average absolute difference between actual values and predicted values.
A lower MAE generally indicates that predictions are closer to the actual values.
For example, if the MAE is 10,000 currency units, the average absolute prediction error is approximately 10,000 currency units, subject to the scale and interpretation of the target variable.
Mean Squared Error — MSE
MSE calculates the average squared difference between actual and predicted values.
Because the errors are squared, larger errors have a greater impact on the metric.
This makes MSE useful when larger prediction errors should be penalized more heavily.
Root Mean Squared Error — RMSE
RMSE is the square root of MSE.
One advantage is that RMSE is expressed in the same units as the target variable.
Lower RMSE generally indicates better prediction accuracy.
R² Score
R², or the coefficient of determination, provides a measure of how well the model explains variation in the target variable.
A value closer to 1 generally indicates stronger explanatory performance on the evaluated dataset.
Scikit-learn's regression scoring interface also uses R² as the default score for a standard single-target LinearRegression estimator.
Model Performance
The trained educational model in this project produced approximately:
MAE: 1320.23
RMSE: 1784.53
R² Score: 0.887
These values are specific to this synthetic dataset and train/test split.
They should not be interpreted as evidence that the model can predict real-world property prices with the same accuracy.
Step 9 — Actual vs Predicted Visualization
The project also generates an Actual vs Predicted visualization.
This graph helps us visually compare:
Actual house prices
versus
Predicted house prices
If the predictions are reasonably close to the actual values, the points should generally follow a strong diagonal pattern.
This provides an intuitive way to inspect model performance.
Step 10 — Save the Trained Model
Once the model has been trained, we save it as:
models/house_price_model.pkl
This allows the trained model to be reused later without retraining it every time.
The project uses Joblib for model serialization.
Project Structure
The GitHub repository contains the following structure:
futuretech-ml-house-price-prediction/
requirements.txt
.gitignore
data/
house_prices.csv
src/
house_price_prediction.py
notebooks/
house_price_prediction.ipynb
models/
house_price_model.pkl
outputs/
actual_vs_predicted.png
What Each File Does
Contains the complete project documentation, learning objectives, workflow, setup instructions, exercises, interview questions, and future enhancement ideas.
requirements.txt
Contains the Python libraries required to run the project.
data/house_prices.csv
Contains the educational house price dataset.
src/house_price_prediction.py
Contains the main Python program for training, evaluating, and using the Machine Learning model.
notebooks/house_price_prediction.ipynb
Provides an interactive notebook version of the project.
models/house_price_model.pkl
Contains the trained Machine Learning model.
outputs/actual_vs_predicted.png
Contains the visualization comparing actual and predicted prices.
Technology Stack
Python
Python is used as the main programming language.
Pandas
Used for data loading and manipulation.
NumPy
Used for numerical operations.
Matplotlib
Used for visualization.
Scikit-learn
Used to create, train, and evaluate the Machine Learning model.
Joblib
Used to save and load the trained model.
How to Run the Project
Clone or download the project from GitHub:
https://github.com/santhulak/futuretech-ml-house-price-prediction
Install the required libraries:
pip install -r requirements.txt
Run the Python program:
python src/house_price_prediction.py
The program will train the model, display evaluation metrics, make a sample prediction, save the trained model, and generate the visualization.
Example Prediction Scenario
Suppose we want to estimate the price of a house with:
Area: 1800 sq ft
Bedrooms: 3
Bathrooms: 2
House Age: 8 years
Parking Spaces: 1
These values are provided to the trained model.
The model then calculates an estimated price based on the relationships it learned from the training dataset.
This demonstrates an important Machine Learning concept:
Training happens once.
Prediction can then be performed on new input data.
What You Learn From This Project
After completing this project, you should understand:
What supervised learning means
What regression problems are
The difference between simple and multiple linear regression
How multiple features can be used for prediction
How to prepare X and y
How to split data into training and testing sets
How to train a Scikit-learn regression model
How to make predictions
How to calculate MAE
How to calculate MSE
How to calculate RMSE
How to interpret R²
How to visualize predictions
How to save a trained model
How to use a trained model for new predictions
Simple Linear Regression vs Multiple Linear Regression
Project #001 used a simple prediction scenario with one primary feature.
Project #002 introduces multiple input variables.
Simple Linear Regression:
One primary feature → Prediction
Multiple Linear Regression:
Multiple features → Prediction
This progression is important for beginners because it introduces the idea that real Machine Learning problems often require several variables rather than a single input.
Understanding Model Coefficients
One useful feature of linear regression is that the trained model provides coefficients.
Each coefficient represents the estimated contribution associated with a feature while considering the other features in the model.
For example, the model may learn coefficients for:
Area_sqft
Bedrooms
Bathrooms
House_Age_Years
Parking_Spaces
However, coefficients should be interpreted carefully.
A coefficient does not automatically prove that a feature causes a change in the target.
It represents the relationship learned by the model under the assumptions of the regression setup.
Highly correlated features can also make coefficient estimates less stable, an issue commonly referred to as multicollinearity. Scikit-learn's documentation highlights this consideration for ordinary least-squares regression.
Important Machine Learning Concepts
This project introduces several concepts that become increasingly important in advanced Machine Learning projects.
Feature Engineering
Choosing useful features can significantly influence model performance.
For a real house price system, additional features could include:
Location
Neighborhood
Property type
Floor number
Year built
Distance from public transport
Nearby schools
Nearby hospitals
Land area
Amenities
Local market trends
Data Leakage
Data leakage occurs when information that should not be available during prediction is accidentally used during model training.
For example, using information that becomes known only after the property is sold would not be appropriate when predicting the price before the sale.
Avoiding leakage is essential for building reliable Machine Learning systems.
Generalization
A good Machine Learning model should not simply memorize the training dataset.
It should perform reasonably well on unseen data.
This is why the project evaluates the model using a separate testing dataset.
Practical Exercises for Students
After completing the basic project, try these exercises.
Exercise 1 — Add More Features
Add additional property characteristics to the dataset.
For example:
Floor number
Property type
Location category
Year built
Exercise 2 — Change the Train/Test Ratio
Experiment with:
70/30
80/20
90/10
Compare the evaluation metrics.
Exercise 3 — Compare Models
Try other regression algorithms such as:
Ridge Regression
Lasso Regression
Random Forest Regression
Decision Tree Regression
Compare their performance with Linear Regression.
Exercise 4 — Create a Prediction Interface
Build a simple Python interface where a user can enter:
Area
Bedrooms
Bathrooms
House age
Parking spaces
The program should then display the estimated price.
Exercise 5 — Build a Web Application
Convert the Machine Learning model into a small web application using:
Streamlit
or
Flask
This would turn the Machine Learning model into a usable application.
Exercise 6 — Add Data Visualization
Create additional charts showing:
Price vs Area
Price vs Bedrooms
Price vs Bathrooms
Price vs House Age
Price distribution
Exercise 7 — Improve the Dataset
Create a larger dataset with more realistic relationships and additional variables.
Then retrain and compare the model performance.
Common Beginner Mistakes
Mistake 1 — Training and Testing on the Same Data
This can produce misleadingly good results.
Always evaluate your model on unseen data.
Mistake 2 — Ignoring the Dataset
Do not immediately train a model without first understanding the data.
Always inspect the dataset.
Mistake 3 — Using Irrelevant Features
More features do not automatically mean a better model.
Features should have a reasonable relationship with the prediction problem.
Mistake 4 — Ignoring Data Quality
Missing values, incorrect data types, duplicate records, and extreme outliers can affect model performance.
Mistake 5 — Assuming High R² Means a Perfect Model
R² should be considered together with other metrics and the context of the problem.
A high score on a synthetic or poorly designed dataset does not guarantee real-world performance.
Mistake 6 — Treating the Prediction as a Guaranteed Price
A Machine Learning prediction is an estimate based on patterns learned from data.
It is not a guarantee of the actual market value of a property.
Real-World Applications
The same Machine Learning workflow can be adapted to many prediction problems.
Examples include:
House price prediction
Car price prediction
Salary prediction
Sales forecasting
Demand prediction
Insurance cost estimation
Rental price prediction
Student performance prediction
Electricity consumption prediction
Business revenue forecasting
How This Project Fits Into Your ML Learning Journey
The FutureTech Simulation ML Mini-Project Series is designed to gradually increase the complexity of Machine Learning projects.
Project #001:
Student Score Prediction
Algorithm:
Linear Regression
Focus:
Single-variable regression concept
Project #002:
House Price Prediction
Algorithm:
Multiple Linear Regression
Focus:
Multiple features and regression
The next projects can introduce classification, decision trees, ensemble methods, clustering, feature engineering, and eventually more advanced Machine Learning workflows.
Portfolio Value
This project is suitable for students and beginners who want to demonstrate practical Machine Learning skills.
Instead of simply listing:
“I know Machine Learning.”
You can demonstrate:
Dataset handling
Feature selection
Train/test splitting
Regression modeling
Model evaluation
Visualization
Model persistence
GitHub project organization
This makes the project useful as an entry-level Machine Learning portfolio project.
How to Present This Project on Your Resume
You can describe the project as:
“Developed a Python-based House Price Prediction system using Multiple Linear Regression. Prepared a structured dataset, trained and evaluated a regression model using multiple property features, calculated MAE, RMSE and R² metrics, generated actual-versus-predicted visualizations, and saved the trained model for reuse.”
GitHub Repository — Download the Complete Source Code
The complete project is available on GitHub, including:
Python source code
Dataset
Jupyter Notebook
Trained Machine Learning model
Visualization output
Requirements file
Detailed README
GitHub Repository:
https://github.com/santhulak/futuretech-ml-house-price-prediction
Students can open the repository, study the project structure, download or clone the complete source code, run the project locally, and experiment with the model.
Interview Questions Based on This Project
What is supervised learning?
What is regression?
What is the difference between classification and regression?
What is Multiple Linear Regression?
Why do we use multiple features?
What are X and y in a Machine Learning project?
Why do we split data into training and testing sets?
What is MAE?
What is MSE?
What is RMSE?
What is R²?
What does a regression coefficient represent?
What is an intercept?
What is overfitting?
What is data leakage?
What is multicollinearity?
Why should we evaluate a model on unseen data?
How can you improve this house price prediction model?
How would you deploy this model as a web application?
Conclusion
House Price Prediction is a useful second project in a beginner Machine Learning journey because it introduces an important step beyond single-feature prediction.
Instead of using one variable, we now use multiple features to predict a continuous numerical target.
Through this project, you learn the complete basic regression workflow:
Understand the problem
↓
Explore the dataset
↓
Select features
↓
Prepare training and testing data
↓
Train the model
↓
Make predictions
↓
Evaluate performance
↓
Visualize results
↓
Save the trained model
↓
Use the model for new predictions
The most important lesson is not simply learning the Linear Regression algorithm.
It is learning how to take a dataset and turn it into a working Machine Learning solution.
Project #002 — Completed.
Next, we can move toward more advanced Machine Learning concepts and algorithms.
Build → Experiment → Analyze → Improve → Deploy
Complete Source Code:
https://github.com/santhulak/futuretech-ml-house-price-prediction
FutureTech Simulation — Don’t Just Learn Technology. Simulate the Job.


Facebook
Instagram
X
LinkedIn
Youtube
WhatsApp