
Our Latest Articles
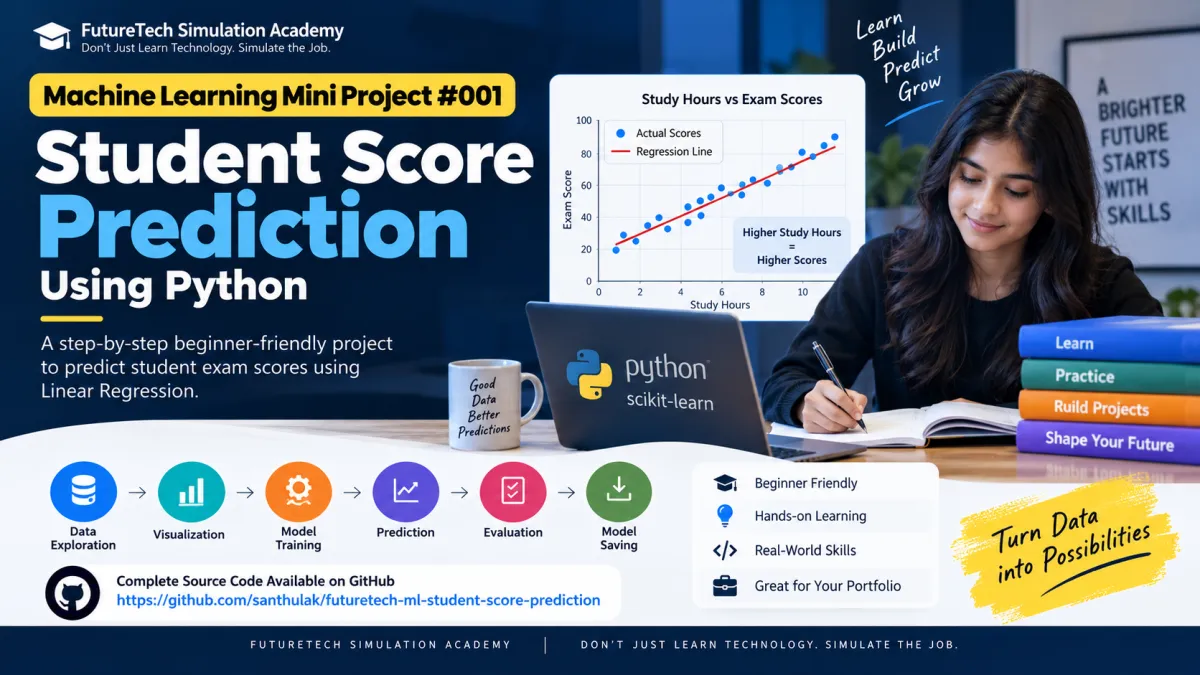
Machine Learning Mini Project #001: Student Score Prediction Using Python
Welcome to the first project in the FutureTech Simulation Machine Learning Mini-Project Series.
In this project, we will build a simple but complete Student Score Prediction system using Python and Linear Regression.
The purpose of this project is to understand how Machine Learning can learn a relationship from historical data and use that relationship to make predictions.
Our question is:
Can we predict a student's exam score based on the number of hours they study?
This project is designed for beginners and introduces the complete Machine Learning workflow:
Dataset → Data Exploration → Visualization → Feature Selection → Train/Test Split → Model Training → Prediction → Evaluation → Visualization → Model Saving
Project Overview
Project Name: Student Score Prediction
Project Number: Machine Learning Mini Project #001
Machine Learning Type: Supervised Learning
Problem Type: Regression
Algorithm: Linear Regression
Programming Language: Python
Libraries: Pandas, NumPy, Matplotlib, Scikit-learn, Joblib
Difficulty: Beginner
GitHub Repository — Download the Complete Code
The complete source code and project files for this project are available on GitHub.
GitHub Repository:
https://github.com/santhulak/futuretech-ml-student-score-prediction
You can use the repository to download the complete project, explore the source code, access the dataset, run the project locally, and experiment with your own modifications.
The repository includes the Python implementation, dataset, Jupyter Notebook, requirements file, project documentation, model file, and output visualization.
Download or explore the complete project here:
https://github.com/santhulak/futuretech-ml-student-score-prediction
The Problem We Are Solving
Imagine that a school has historical information about students' study hours and examination scores.
The school wants to understand whether study time can be used to estimate examination performance.
For example:
A student studies for 2 hours and scores 50.
Another student studies for 4 hours and scores 66.
Another student studies for 6 hours and scores 79.
Another student studies for 8 hours and scores 92.
Instead of manually estimating the score, we can use Machine Learning to learn the relationship between study hours and exam scores.
After training the model, we can provide a new number of study hours and obtain a predicted score.
For example:
Study Hours: 6.5
Predicted Exam Score: Model Prediction
This is a basic example of predictive modeling.
Important Note
This project is created for educational and simulation purposes.
The dataset is intentionally small and should not be used to make real academic decisions.
Actual student performance depends on many factors, including attendance, previous performance, learning methods, assignments, environment, teaching quality, and other variables.
What Is Machine Learning?
Machine Learning is a branch of Artificial Intelligence that allows computers to learn patterns from data and use those patterns to make predictions or decisions.
In traditional programming, we normally provide rules and data to produce an output.
Rules + Data → Output
In Machine Learning, we provide historical examples containing inputs and known outputs.
Data + Expected Output → Machine Learning Model
The model learns patterns from the examples.
After training, the model can be used with new data.
For our project:
Study Hours → Machine Learning Model → Predicted Exam Score
What Is Supervised Learning?
Our project uses Supervised Learning.
In supervised learning, the model is trained using data where both the input and expected output are known.
In this project:
Input: Study Hours
Output: Exam Score
The model studies the relationship between these values and learns a mathematical pattern that can be used for prediction.
What Is Regression?
Regression is a supervised Machine Learning problem where the target is a numerical value.
Examples of regression projects include:
• House Price Prediction
• Salary Prediction
• Sales Prediction
• Temperature Prediction
• Demand Prediction
• Delivery Time Prediction
• Exam Score Prediction
Since our target, Exam Score, is a numerical value, this project is a regression problem.
Why Linear Regression?
Linear Regression is one of the best algorithms for beginners because it provides a simple way to understand how a Machine Learning model learns a relationship between variables.
The basic Linear Regression equation is:
y = mx + b
Where:
y = predicted value
x = input feature
m = coefficient or slope
b = intercept
For our project:
x = Study Hours
y = Exam Score
The model learns the coefficient and intercept from the training data.
The resulting relationship can be represented as:
Exam Score = Coefficient × Study Hours + Intercept
Understanding the Dataset
Our dataset contains two important columns:
Study_Hours
This represents the number of hours a student studied.
Exam_Score
This represents the student's examination score.
Example:
Study Hours: 1.0
Exam Score: 42
Study Hours: 1.5
Exam Score: 45
Study Hours: 2.0
Exam Score: 50
Study Hours: 2.5
Exam Score: 54
Study Hours: 3.0
Exam Score: 58
Study Hours: 3.5
Exam Score: 62
Study Hours: 4.0
Exam Score: 66
Study Hours: 4.5
Exam Score: 69
Study Hours: 5.0
Exam Score: 73
Study Hours: 5.5
Exam Score: 76
Study Hours: 6.0
Exam Score: 79
Study Hours: 6.5
Exam Score: 82
Study Hours: 7.0
Exam Score: 85
Study Hours: 7.5
Exam Score: 88
Study Hours: 8.0
Exam Score: 92
The GitHub repository contains the dataset used for the project.
Feature and Target
A Machine Learning model generally has inputs and an output that we want to predict.
The input variables are called features.
The variable we want to predict is called the target.
For this project:
Feature: Study_Hours
Target: Exam_Score
The Machine Learning process is:
Study Hours → Model → Exam Score
Technology Used
Python
Python is used to build the Machine Learning application.
Pandas
Pandas is used to load, inspect, and manipulate the dataset.
NumPy
NumPy provides numerical computing functionality.
Matplotlib
Matplotlib is used to visualize the data and model results.
Scikit-learn
Scikit-learn provides the Linear Regression algorithm, train/test splitting functionality, and evaluation metrics.
Joblib
Joblib is used to save and load the trained Machine Learning model.
Project Structure
The GitHub repository follows a practical project structure:
futuretech-ml-student-score-prediction
data
student_scores.csv
notebooks
student_score_prediction.ipynb
src
student_score_prediction.py
models
student_score_model.pkl
outputs
actual_vs_predicted.png
requirements.txt
.gitignore
The repository currently contains the dataset, notebook, source code, model, output, README and requirements file.
Step 1 — Install Python
Make sure Python is installed on your computer.
Open Command Prompt or Terminal and check your Python installation:
python --version
If Python is installed correctly, you will see the installed Python version.
Step 2 — Install Required Libraries
Install the required libraries:
pip install pandas numpy matplotlib scikit-learn joblib jupyter
If you download the GitHub project, you can install the dependencies using:
pip install -r requirements.txt
The repository includes a requirements.txt file for the project's dependencies.
Step 3 — Load the Dataset
The dataset is located inside the data folder.
File name:
student_scores.csv
We can use Pandas to load the CSV dataset.
The first step is to bring the data into our Python environment so that we can analyze it.
Step 4 — Explore the Dataset
Before training a model, we should understand the data.
We can examine:
• Number of rows
• Number of columns
• Column names
• Data types
• Missing values
• Statistical information
This process is called Exploratory Data Analysis, commonly known as EDA.
EDA is an important part of Machine Learning because the quality of our model depends heavily on the quality and understanding of our data.
Step 5 — Check for Missing Values
We should check whether the dataset contains missing values.
For this educational dataset, the required values are complete.
In real-world projects, missing values may require preprocessing.
Common approaches include:
• Removing records
• Mean imputation
• Median imputation
• Mode imputation
• Model-based imputation
The correct approach depends on the type of data and the business problem.
Step 6 — Visualize the Data
Before training the model, let's understand the relationship between study hours and exam scores.
A scatter plot can be used to visualize the data.
The X-axis represents:
Study Hours
The Y-axis represents:
Exam Score
If the points generally move upward as study hours increase, we can observe a positive relationship.
This makes Linear Regression a reasonable algorithm to explore for this simple educational dataset.
Step 7 — Define the Feature
Our feature is:
Study_Hours
The feature represents the input provided to the Machine Learning model.
Conceptually:
Study_Hours → Model
Step 8 — Define the Target
Our target is:
Exam_Score
This is the value that the model needs to predict.
Conceptually:
Study_Hours → Machine Learning Model → Exam_Score
Step 9 — Split the Dataset
We need to divide our dataset into two parts:
Training Data
and
Testing Data
The training data is used to teach the model.
The testing data is used to evaluate how the model performs on observations that were not used during training.
For this project, we use an 80/20 split.
Approximately:
80% → Training
20% → Testing
A fixed random state can be used to make the split reproducible.
Step 10 — Create the Linear Regression Model
Now we create the Linear Regression model.
At this stage, the model has not learned the relationship between study hours and exam scores.
The model will learn this relationship during training.
Step 11 — Train the Model
Training is the most important stage of the Machine Learning process.
During training, the Linear Regression algorithm examines the training observations and finds the best-fitting linear relationship between the feature and target.
The model can be represented as:
Exam Score = m × Study Hours + b
Here:
m represents the learned coefficient.
b represents the learned intercept.
Step 12 — Make Predictions
Once the model has been trained, we can use it to make predictions.
We provide the test data to the model.
The model generates predicted exam scores.
We can then compare the predicted scores with the actual scores.
This gives us an understanding of how well the model generalizes to unseen observations.
Step 13 — Predict a New Student's Score
Now let's use the trained model with a new example.
Suppose a student studied for:
6.5 hours
We provide:
Study_Hours = 6.5
to the trained model.
The model returns an estimated examination score.
The exact prediction is generated by the trained model when the project is executed.
The GitHub repository includes an example using 6.5 study hours.
Step 14 — Evaluate the Model
A Machine Learning model should not be judged only by whether it produces a prediction.
We need to evaluate how accurate those predictions are.
For regression problems, we can use:
MAE
MSE
RMSE
R²
Mean Absolute Error — MAE
MAE stands for Mean Absolute Error.
It measures the average absolute difference between the actual values and predicted values.
A lower MAE generally indicates smaller prediction errors.
For example, if the MAE is 3, the predictions differ from the actual values by approximately 3 points on average for the evaluated observations.
Mean Squared Error — MSE
MSE stands for Mean Squared Error.
It calculates the average squared difference between actual and predicted values.
Because the errors are squared, larger errors have a greater impact on the metric.
A lower MSE generally indicates smaller errors.
Root Mean Squared Error — RMSE
RMSE stands for Root Mean Squared Error.
It is calculated as the square root of MSE.
One advantage of RMSE is that it is expressed in the same units as the target variable.
Since our target is Exam Score, RMSE is expressed in score points.
R² Score
R² is called the coefficient of determination.
It provides an indication of how much variation in the target is explained by the model on the evaluated data.
A value closer to 1 can indicate strong explanatory performance, although R² should be interpreted together with other metrics and the characteristics of the dataset.
Step 15 — Compare Actual and Predicted Scores
We can create a comparison table containing:
Study Hours
Actual Score
Predicted Score
Error
This makes it easier to understand individual predictions.
Instead of looking at only one overall metric, we can examine how the model performed for each test observation.
Step 16 — Visualize the Regression Line
One of the best ways to understand Linear Regression is through visualization.
We can display:
• Actual data points
• Regression line
The data points represent the observed student records.
The regression line represents the relationship learned by the Linear Regression model.
This provides an intuitive explanation of how the algorithm fits a mathematical relationship to the data.
Step 17 — Save the Trained Model
After training the model, we can save it using Joblib.
The repository includes a models directory for storing the trained model.
Saving the model allows us to reuse it later without retraining the model from the beginning.
This is an important concept when moving from a Machine Learning experiment to an actual application.
Complete Machine Learning Workflow
The complete workflow used in this project is:
1. Load the dataset
2. Explore the data
3. Check data quality
4. Visualize the data
5. Identify the feature
6. Identify the target
7. Split the data
8. Create the model
9. Train the model
10. Generate predictions
11. Evaluate the model
12. Visualize the results
13. Save the trained model
14. Use the model for new predictions
Understanding this workflow is more important than simply memorizing individual Python commands.
You will see this same general workflow throughout the Machine Learning mini-project series.
Practical Challenges
Once you successfully run the project, try extending it.
Challenge 1 — Add More Student Data
Add additional student records to the CSV dataset.
Retrain the model and compare the evaluation metrics.
Challenge 2 — Add Attendance
Add an Attendance feature.
Your dataset could contain:
Study_Hours
Attendance
Exam_Score
Then investigate whether the additional feature changes model performance.
Challenge 3 — Add Previous Exam Score
Add:
Previous_Exam_Score
Use it as another feature and compare the results.
Challenge 4 — Change the Test Size
Experiment with:
20%
25%
30%
Observe how the evaluation metrics change.
Challenge 5 — Try Another Algorithm
Experiment with:
Decision Tree Regressor
Random Forest Regressor
Compare their performance with Linear Regression.
Challenge 6 — Create User Input
Build a simple Python application that asks:
Enter study hours:
Then returns:
Predicted Exam Score:
This will help you understand how a trained Machine Learning model can be integrated into an application.
Common Beginner Mistakes
Training and Testing Using the Same Data
A model should be evaluated using appropriate unseen data.
Evaluating a model on the same observations used during training can provide an overly optimistic estimate of its performance.
Skipping Data Exploration
Do not immediately train a Machine Learning model.
First understand the dataset.
Check the columns, data types, missing values, distributions, and relationships.
Using the Wrong Problem Type
Regression is generally used to predict numerical values.
Classification is generally used to predict categories.
For example:
Exam Score → Regression
Pass or Fail → Classification
Looking Only at One Evaluation Metric
A single metric does not always tell the complete story.
Use multiple appropriate metrics and understand what each metric represents.
Assuming Correlation Means Causation
If study hours and exam scores are positively related in this dataset, that does not prove that study hours alone cause a particular score.
Real-world analysis requires more comprehensive data and careful interpretation.
Portfolio Project
This project can be added to a beginner's Machine Learning portfolio.
Example project description:
Student Score Prediction Using Machine Learning
Developed a student score prediction system using Python, Pandas and Scikit-learn. Implemented data exploration, visualization, train/test splitting, Linear Regression, prediction, regression evaluation metrics and model persistence.
A good GitHub portfolio should demonstrate the complete project rather than only showing a few lines of code.
This project gives beginners an opportunity to demonstrate their understanding of the basic Machine Learning development lifecycle.
Download the Complete Source Code
The complete project is available on GitHub.
GitHub Repository:
https://github.com/santhulak/futuretech-ml-student-score-prediction
The repository contains the project structure, dataset, Python source code, Jupyter Notebook, model and supporting files.
Get the project here:
https://github.com/santhulak/futuretech-ml-student-score-prediction
You can download the repository and run the project on your own computer.
Interview Questions
After completing this project, you should be able to answer:
What is Machine Learning?
What is supervised learning?
What is regression?
What is Linear Regression?
What is a feature?
What is a target variable?
Why do we split data into training and testing sets?
What is model training?
What is the purpose of the fit operation?
What is the purpose of the predict operation?
What is MAE?
What is MSE?
What is RMSE?
What is R²?
What is overfitting?
Why should a model be evaluated on unseen data?
What is the difference between regression and classification?
Why is data visualization important in Machine Learning?
Why do we save trained Machine Learning models?
What is a regression coefficient?
What is the intercept in Linear Regression?
What We Built
In this project, we built a complete Student Score Prediction System using Python and Linear Regression.
We started with historical study-hour and exam-score data.
We then explored the dataset, visualized the relationship between the variables, selected the feature and target, divided the data into training and testing sets, trained a Linear Regression model, generated predictions, evaluated the model, visualized the regression relationship, and saved the trained model.
The project demonstrates the fundamental Machine Learning workflow:
Data → Explore → Prepare → Train → Predict → Evaluate → Improve
Conclusion
Student Score Prediction is a simple project, but it introduces many of the fundamental concepts required to start working with Machine Learning.
The goal of this project is not to create a production-ready academic prediction system.
The goal is to understand how a Machine Learning project works from beginning to end.
By completing this project, you have taken the first step from learning Machine Learning theory to building a practical Machine Learning application.
The next projects in this series will gradually introduce more complex datasets, multiple features, classification algorithms, data preprocessing, model comparison, feature engineering, and more advanced Machine Learning techniques.
The objective is not simply to memorize algorithms.
The objective is to:
Build → Experiment → Analyze → Improve → Deploy
Next Project
Machine Learning Mini Project #002: House Price Prediction Using Python
In the next project, we will work with a more realistic regression problem and explore how multiple property-related factors can be used to predict house prices.
Stay connected with FutureTech Simulation Academy for the upcoming projects in this practical Machine Learning series.
FutureTech Simulation Academy
Don't Just Learn Technology. Simulate the Job.


Facebook
Instagram
X
LinkedIn
Youtube
WhatsApp