
Our Latest Articles
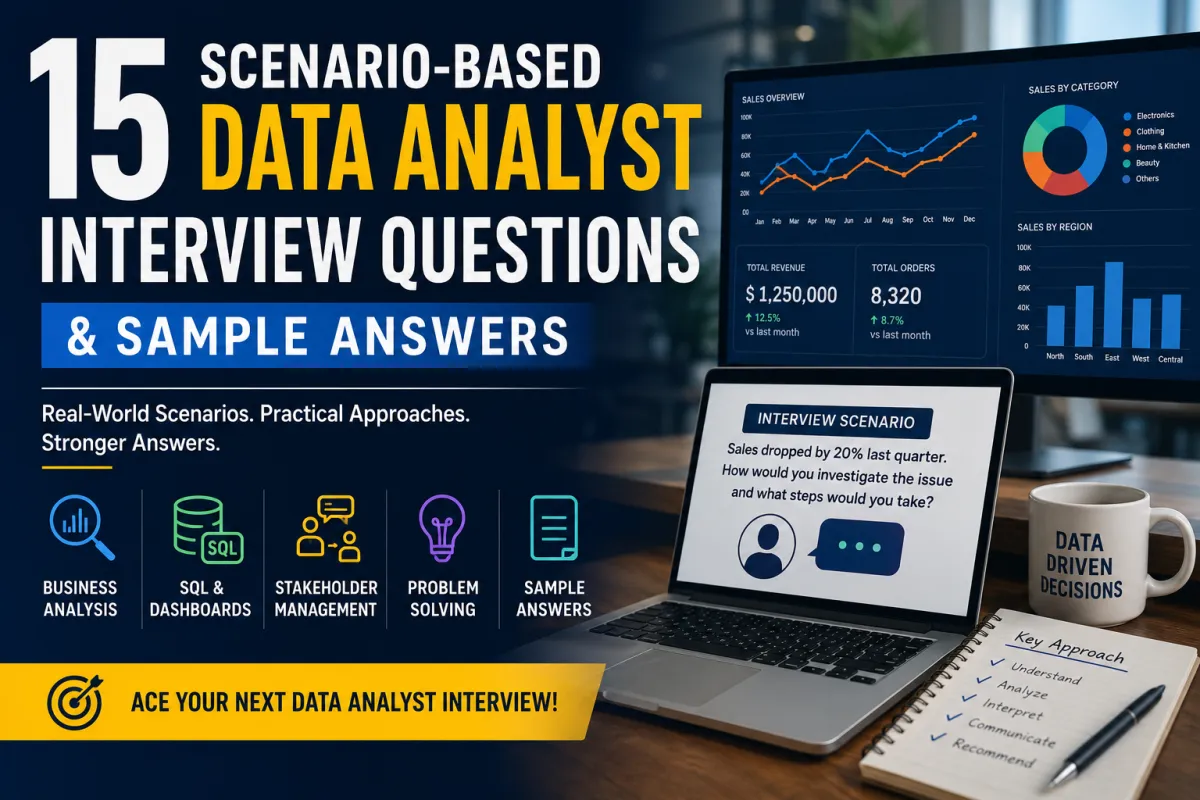
15 Scenario-Based Data Analyst Interview Questions
Many aspiring Data Analysts spend hours preparing SQL queries, statistics concepts, and Excel formulas, only to feel surprised when interviewers ask scenario-based questions.
Why?
Because companies want more than technical knowledge.
They want to understand:
How you think
How you solve problems
How you communicate insights
How you handle real business situations
Scenario-based interview questions help employers evaluate analytical thinking, decision-making skills, and business understanding.
In this guide, we'll explore common scenario-based Data Analyst interview questions along with approaches to answering them effectively.
What Are Scenario-Based Interview Questions?
Scenario-based questions present a business problem and ask how you would approach it.
Instead of asking:
"Do you know Excel?"
An interviewer may ask:
"Sales dropped by 20% last quarter. How would you investigate the issue?"
These questions assess:
Problem-solving ability
Analytical thinking
Communication skills
Business understanding
Data interpretation
Question 1
Sales Dropped by 20%. How Would You Investigate?
What Interviewers Want
Your analytical approach.
Sample Answer
I would start by validating the data to ensure the decline is real and not caused by reporting issues.
Next, I would analyze:
Product categories
Geographic regions
Customer segments
Marketing campaigns
Seasonal trends
I would compare current performance with previous periods and identify where the largest decline occurred before recommending corrective actions.
Question 2
A Manager Says the Dashboard Numbers Look Wrong. What Would You Do?
Sample Answer
I would first verify the data source and understand which metrics appear incorrect.
Then I would:
Validate calculations
Compare dashboard results with raw data
Check filters and date ranges
Review recent changes to data pipelines
Once the root cause is identified, I would communicate findings clearly to stakeholders.
Question 3
You Have Multiple Requests from Different Teams. How Would You Prioritize?
Sample Answer
I would evaluate:
Business impact
Urgency
Stakeholder priorities
Resource requirements
High-impact and time-sensitive requests would be addressed first while maintaining transparency with all stakeholders regarding timelines.
Question 4
A Dataset Contains Many Missing Values. What Would You Do?
Sample Answer
My approach depends on the percentage and importance of missing data.
Possible actions include:
Removing records
Replacing values using statistical methods
Using business rules
Investigating data collection issues
I would document all assumptions and evaluate how missing values affect analysis accuracy.
Question 5
Customer Churn Increased Significantly. How Would You Analyze It?
Sample Answer
I would compare retained and churned customers based on:
Demographics
Purchase history
Customer support interactions
Subscription plans
Product usage
The goal is identifying patterns that explain why customers are leaving.
Question 6
Your Analysis Contradicts a Senior Manager's Opinion. What Would You Do?
Sample Answer
I would respectfully present the data, methodology, and supporting evidence.
The discussion should remain focused on facts rather than opinions.
If needed, I would perform additional validation to ensure confidence in the findings.
Question 7
How Would You Measure the Success of a Marketing Campaign?
Sample Answer
I would define KPIs such as:
Conversion Rate
Customer Acquisition Cost
Revenue Generated
Return on Investment
Click-Through Rate
Comparing results against campaign objectives would determine effectiveness.
Question 8
A Stakeholder Requests a Report with Very Little Information. What Would You Do?
Sample Answer
I would ask clarifying questions such as:
What decision will this report support?
Who is the audience?
Which KPIs matter most?
What time period should be analyzed?
Clear requirements reduce rework and improve report usefulness.
Question 9
How Would You Identify Outliers in a Dataset?
Sample Answer
I would use:
Box Plots
Z-Scores
Interquartile Range (IQR)
Statistical Analysis
After identifying outliers, I would determine whether they represent errors or meaningful business events.
Question 10
Website Traffic Increased but Sales Did Not. How Would You Explain This?
Sample Answer
I would investigate:
Traffic sources
Landing page performance
User behavior
Conversion funnel metrics
Cart abandonment rates
More visitors do not necessarily mean better-quality traffic.
Question 11
How Would You Present Complex Data to Non-Technical Stakeholders?
Sample Answer
I would focus on business impact rather than technical details.
I would use:
Simple visualizations
Clear storytelling
Actionable recommendations
The goal is helping stakeholders make decisions, not impressing them with technical jargon.
Question 12
How Would You Detect Fraudulent Transactions?
Sample Answer
I would analyze:
Unusual spending patterns
Geographic anomalies
Transaction frequency
Device information
Historical behavior
Machine learning models and rule-based systems could help identify suspicious activities.
Question 13
What Would You Do If Two Data Sources Show Different Numbers?
Sample Answer
I would:
Verify source definitions
Check refresh schedules
Review transformation logic
Compare calculation methodologies
Different business definitions often explain discrepancies.
Question 14
How Would You Improve a Poorly Performing Dashboard?
Sample Answer
I would gather user feedback and evaluate:
Load time
Visual design
KPI relevance
Ease of navigation
Business usefulness
The best dashboards support decision-making, not just display data.
Question 15
How Would You Analyze Why Users Stop Using an Application?
Sample Answer
I would examine:
User engagement metrics
Session duration
Feature adoption
User feedback
Customer support tickets
Understanding user behavior patterns helps identify opportunities for improvement.
Common Framework for Answering Scenario-Based Questions
A simple framework is:
Step 1: Understand the Problem
Clarify requirements and objectives.
Step 2: Validate the Data
Ensure accuracy before drawing conclusions.
Step 3: Analyze the Situation
Break the problem into smaller components.
Step 4: Communicate Findings
Present insights clearly.
Step 5: Recommend Actions
Focus on business outcomes.
Tips for Data Analyst Interviews
Think Before Answering
Interviewers value structured thinking.
Ask Clarifying Questions
Never assume requirements.
Focus on Business Impact
Analysis should support decisions.
Explain Your Process
Interviewers often care more about your approach than the final answer.
Practice Real Scenarios
The more business cases you solve, the more confident you'll become.
Final Thoughts
Technical skills such as SQL, Excel, Python, Power BI, and Tableau are important, but scenario-based questions often determine whether you receive an offer.
Employers want analysts who can connect data with business decisions.
When preparing for interviews, focus not only on tools but also on understanding how to approach problems, communicate findings, and provide actionable recommendations.
The best Data Analysts are not just data experts—they are problem solvers who use data to create business value.


Facebook
Instagram
X
LinkedIn
Youtube
WhatsApp