
Our Latest Articles
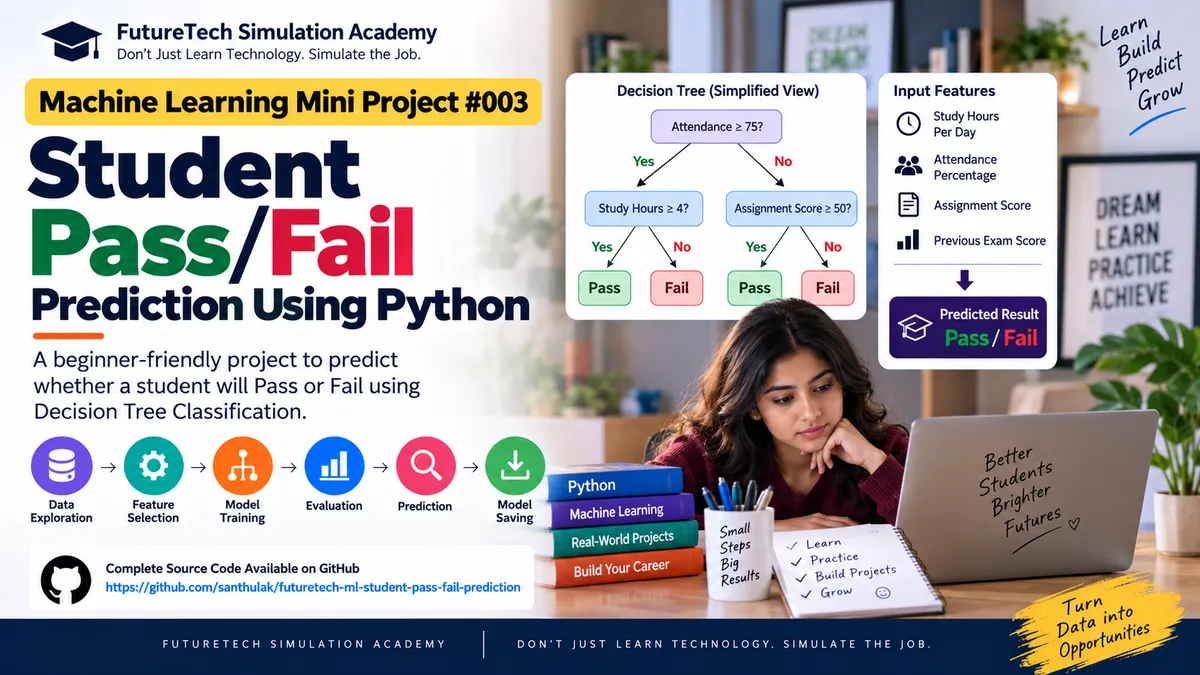
Machine Learning Mini Project #003: Student Pass/Fail Prediction Using Python
Welcome to Project #003 of the FutureTech Simulation Machine Learning Mini-Project Series.
In Project #001, we built a Student Score Prediction system using Linear Regression.
In Project #002, we moved to Multiple Linear Regression and built a House Price Prediction system using multiple features.
Now we are moving from Regression to Classification.
In this project, we will build a Student Pass/Fail Prediction system using Python and a Decision Tree Classifier.
The model will analyze student-related features such as study hours, attendance, assignment performance, and previous exam performance and classify the expected result as:
Pass
or
Fail
The complete source code, dataset, Jupyter Notebook, trained model, visualizations, and project files are available on GitHub:
https://github.com/santhulak/futuretech-ml-student-pass-fail-prediction
You can open the repository, study the project, and download the complete source code and project files from GitHub.
Project Overview
Imagine that a college wants to build an early academic-support system.
The college has information about students such as:
• Daily study hours
• Attendance percentage
• Assignment score
• Previous examination score
The college wants to identify whether a student is likely to pass or fail based on these characteristics.
This is different from predicting an exact numerical score.
We are now predicting a category.
Therefore, this is a classification problem.
What Will You Build?
You will build a Machine Learning system that predicts:
Pass
or
Fail
based on:
Study Hours Per Day
Attendance Percentage
Assignment Score
Previous Exam Score
The project uses a Decision Tree Classifier.
A Decision Tree Classifier learns decision rules from training data and can predict both classes and class probabilities.
Project Details
Project Number: #003
Project Name: Student Pass/Fail Prediction Using Python
Machine Learning Type: Supervised Learning
Problem Type: Binary Classification
Algorithm: Decision Tree Classifier
Programming Language: Python
Dataset: Educational synthetic dataset
Level: Beginner → Intermediate
Libraries: Pandas, NumPy, Matplotlib, Scikit-learn, Joblib
GitHub Repository:
https://github.com/santhulak/futuretech-ml-student-pass-fail-prediction
Why Classification?
There are many types of Machine Learning problems.
Regression predicts numerical values.
Examples:
House Price
Salary
Exam Score
Sales Revenue
Temperature
Classification predicts categories.
Examples:
Pass / Fail
Spam / Not Spam
Fraud / Not Fraud
Approved / Rejected
Churn / Not Churn
In Project #001, we predicted a student's score.
That was regression.
In this project, we predict whether the student belongs to the Pass or Fail category.
That is classification.
Regression vs Classification
Project #001:
Student Score Prediction
Input:
Study Hours
Output:
Exam Score
Problem:
Regression
Project #002:
House Price Prediction
Input:
Area, bedrooms, bathrooms, age, parking
Output:
House Price
Problem:
Regression
Project #003:
Student Pass/Fail Prediction
Input:
Study hours, attendance, assignment score, previous exam score
Output:
Pass / Fail
Problem:
Classification
This progression helps beginners understand the difference between numerical prediction and categorical prediction.
Real-World Scenario
Consider a college with thousands of students.
The academic team wants to identify students who may require additional academic support.
Instead of manually examining every student's information, a Machine Learning model could analyze historical patterns.
For example:
Student A
Study Hours: 7
Attendance: 92%
Assignment Score: 88
Previous Exam Score: 81
The model may classify the student as:
Pass
Another student may have:
Study Hours: 2
Attendance: 58%
Assignment Score: 45
Previous Exam Score: 42
The model may classify the student as:
Fail
The purpose of such a system would be to support academic intervention, not to make irreversible decisions about students.
This project is educational and uses synthetic data.
Important Dataset Note
The dataset included in this project is a synthetic educational dataset created for Machine Learning practice.
It is not real student data.
It should not be used to make decisions about actual students.
A real student prediction system would require:
• Representative historical data
• Privacy protections
• Appropriate data governance
• Bias and fairness evaluation
• Model validation
• Human oversight
• Continuous monitoring
Dataset Features
The project contains four input features.
Study_Hours_Per_Day
The approximate number of hours the student studies per day.
Example:
2.5
4.0
6.5
8.0
Attendance_Percent
The student's attendance percentage.
Example:
65
78
88
95
Assignment_Score
The student's assignment performance score.
Example:
45
62
82
94
Previous_Exam_Score
The student's previous examination score.
Example:
42
58
76
89
Target Variable
The target variable is:
Result
Possible values:
Pass
Fail
Project Workflow
The complete Machine Learning workflow is:
Dataset
↓
Data Exploration
↓
Feature Selection
↓
Target Selection
↓
Train/Test Split
↓
Decision Tree Training
↓
Prediction
↓
Model Evaluation
↓
Confusion Matrix
↓
Classification Report
↓
Visualization
↓
Model Saving
↓
New Student Prediction
Step 1 — Load the Dataset
The dataset is stored in:
data/student_pass_fail.csv
We use Pandas to load the CSV file.
The first step is to understand the structure of the data.
We should inspect:
• Number of rows
• Number of columns
• Column names
• Data types
• Missing values
• Class distribution
Step 2 — Explore the Dataset
Before training a Machine Learning model, we should understand the data.
For example, we can investigate:
How many students are in the dataset?
How many students are classified as Pass?
How many are classified as Fail?
What is the average attendance?
What is the average study time?
Are there missing values?
Are the classes reasonably represented?
This process is part of Exploratory Data Analysis.
Step 3 — Select the Features
The model uses four features:
Study_Hours_Per_Day
Attendance_Percent
Assignment_Score
Previous_Exam_Score
These become the input variable X.
The target variable Result becomes y.
Conceptually:
X = Student Information
y = Pass / Fail
Step 4 — Train/Test Split
The dataset is divided into:
Training Data
Testing Data
The training data is used to teach the model.
The testing data is used to evaluate the model on records that were not used during training.
This project uses an 80/20 split.
Approximately:
80% → Training
20% → Testing
The project also uses stratification so that the class distribution is better preserved between the training and testing sets.
Step 5 — Create the Decision Tree
The project uses:
DecisionTreeClassifier
from Scikit-learn.
A Decision Tree learns a sequence of rules that divide the training data into increasingly homogeneous groups.
The model can then follow those learned rules when making predictions. Scikit-learn's current documentation describes DecisionTreeClassifier as a classifier that can learn class labels and return class probabilities.
Understanding a Decision Tree
Think of a Decision Tree as a series of questions.
For example:
Is attendance greater than a certain value?
↓
Yes / No
Then:
Is assignment score greater than a certain value?
↓
Yes / No
Then:
Are study hours greater than a certain value?
↓
Pass / Fail
The actual thresholds are learned automatically from the training data.
The model builds these rules based on the features available.
Root Node
The root node is the starting point of the Decision Tree.
It contains the first major decision.
For example:
Attendance > X?
or
Previous Exam Score > X?
Internal Nodes
Internal nodes represent additional decisions.
For example:
Assignment Score > X?
Branches
Branches represent different outcomes of a decision.
For example:
Yes
No
Leaf Nodes
Leaf nodes contain the final classification.
For example:
Pass
or
Fail
Step 6 — Train the Model
The Decision Tree is trained using the training data.
Conceptually:
model.fit(X_train, y_train)
During training, the algorithm searches for useful splits that separate the classes.
The project uses:
criterion = "gini"
max_depth = 4
random_state = 42
Understanding Gini Impurity
Gini impurity is one of the criteria that can be used to evaluate potential splits in a Decision Tree.
The goal is to create branches where the resulting groups are as pure as possible with respect to the target classes.
Scikit-learn's DecisionTreeClassifier supports Gini impurity as well as other criteria such as entropy and log loss in current versions.
Why max_depth = 4?
Decision Trees can become very deep.
A very deep tree can memorize the training data.
This can result in:
Very high training performance
but
Poor performance on unseen data.
This is called overfitting.
Limiting the maximum tree depth is one way to control model complexity.
In this educational project:
max_depth = 4
This keeps the tree relatively small and easier for beginners to understand.
Step 7 — Make Predictions
After training the model, we use:
model.predict()
to classify new students.
The output will be:
Pass
or
Fail
Step 8 — Prediction Probabilities
Decision Trees can also provide class probabilities using:
model.predict_proba()
For example, a model might produce:
Pass: 0.85
Fail: 0.15
The predicted class would be Pass.
These probabilities should not automatically be interpreted as guaranteed real-world probabilities. Proper validation and probability calibration may be necessary in production systems.
Example Student
The project includes a sample student:
Study Hours Per Day:
6.5
Attendance:
88%
Assignment Score:
82
Previous Exam Score:
76
The trained model uses these four values to generate a Pass/Fail prediction.
The project also displays the associated class probabilities.
Step 9 — Evaluate the Model
Classification models require different evaluation metrics from regression models.
This project uses:
Accuracy
Confusion Matrix
Precision
Recall
F1-score
Accuracy
Accuracy represents the proportion of predictions that were classified correctly.
For example:
100 test students
85 correctly classified
Accuracy:
85%
However, accuracy should not always be used alone, particularly when classes are imbalanced.
Confusion Matrix
A confusion matrix compares actual classes with predicted classes.
For binary classification, it can show:
True Positive
True Negative
False Positive
False Negative
Scikit-learn defines the confusion matrix as a way to evaluate classification results by counting observations according to their true and predicted classes.
The project generates:
outputs/confusion_matrix.png
Understanding the Confusion Matrix
Suppose the classes are:
Fail
Pass
The matrix can be interpreted as:
Actual Fail → Predicted Fail
Actual Fail → Predicted Pass
Actual Pass → Predicted Fail
Actual Pass → Predicted Pass
This helps us understand not only how many predictions were correct, but also what kinds of mistakes the model made.
Precision
Precision answers:
"Of the students predicted as a particular class, how many actually belonged to that class?"
Precision is especially useful when false positive predictions have important consequences.
Recall
Recall answers:
"Of the students who actually belonged to a particular class, how many did the model correctly identify?"
Recall becomes particularly important when missing cases is costly.
F1-Score
F1-score combines precision and recall into a single metric.
It can be useful when we want to consider both types of classification performance together.
Scikit-learn provides standard classification metrics including accuracy, precision, recall, F1-score, and confusion matrix functionality.
Model Performance
Using the included synthetic dataset and the fixed 80/20 stratified test split, the model achieved:
Accuracy: 81.25%
This result is specific to this educational dataset, model configuration, and train/test split.
It should not be interpreted as the expected accuracy of a real-world student performance prediction system.
Step 10 — Visualize the Decision Tree
The project generates:
outputs/decision_tree.png
This visualization allows students to see the actual decision rules learned by the model.
You can examine:
• Root node
• Decision conditions
• Branches
• Leaf nodes
• Predicted classes
Why Visualization Matters
Machine Learning should not be treated as a black box whenever the model and problem allow interpretation.
A Decision Tree provides an intuitive visual representation of how predictions are made.
Students can inspect the tree and ask:
Which feature appears near the root?
Which feature is used most frequently?
Which conditions lead to Pass?
Which conditions lead to Fail?
How deep is the tree?
Feature Importance
Decision Trees also provide feature importance values.
Scikit-learn describes feature_importances_ as the normalized total reduction in the splitting criterion contributed by each feature. It also warns that impurity-based feature importance can be misleading in some situations.
You can experiment with:
model.feature_importances_
This can help you explore which variables the trained tree relied on most.
However:
Feature importance does not prove causation.
A feature can be useful for prediction without being the cause of the outcome.
Project Structure
The GitHub project contains:
futuretech-ml-student-pass-fail-prediction/
requirements.txt
.gitignore
data/
student_pass_fail.csv
src/
student_pass_fail_prediction.py
notebooks/
student_pass_fail_prediction.ipynb
models/
student_pass_fail_model.pkl
outputs/
confusion_matrix.png
decision_tree.png
What Each File Does
Contains complete project documentation, setup instructions, Machine Learning concepts, exercises, interview questions, and future enhancement ideas.
requirements.txt
Contains the Python libraries required for the project.
data/student_pass_fail.csv
Contains the educational student dataset.
src/student_pass_fail_prediction.py
Contains the main Python implementation.
It:
• Loads the dataset
• Selects features
• Splits the data
• Trains the Decision Tree
• Evaluates the model
• Saves the model
• Predicts a new student's result
notebooks/student_pass_fail_prediction.ipynb
Contains an interactive Jupyter Notebook version of the project.
models/student_pass_fail_model.pkl
Contains the trained Decision Tree model.
outputs/confusion_matrix.png
Visualizes classification performance.
outputs/decision_tree.png
Visualizes the learned Decision Tree.
Technology Stack
Python
Main programming language.
Pandas
Used for data loading and manipulation.
NumPy
Used for numerical operations.
Matplotlib
Used for visualization.
Scikit-learn
Used for:
• Train/test splitting
• Decision Tree classification
• Accuracy
• Confusion matrix
• Classification report
Joblib
Used to save the trained model.
Jupyter Notebook
Used for interactive Machine Learning experimentation.
How to Run the Project
Download or clone the complete project from GitHub:
https://github.com/santhulak/futuretech-ml-student-pass-fail-prediction
Install the dependencies:
pip install -r requirements.txt
Run the project:
python src/student_pass_fail_prediction.py
What Happens When You Run the Project?
The program:
Loads the dataset.
Displays the dataset information.
Displays the class distribution.
Selects the input features.
Splits the dataset.
Creates the Decision Tree.
Trains the model.
Generates predictions.
Calculates accuracy.
Generates the confusion matrix.
Displays the classification report.
Saves the trained model.
Predicts the result for a new student.
Practical Exercise 1 — Change max_depth
Try:
max_depth = 2
Then:
max_depth = 3
Then:
max_depth = 4
Then:
max_depth = 6
Then:
max_depth = None
Record:
Training Accuracy
Testing Accuracy
Tree Depth
Compare the results.
This exercise helps you understand overfitting.
Practical Exercise 2 — Add More Features
Add additional student-related features such as:
Quiz Score
Project Score
Assignments Completed
Study Consistency
Participation Score
Then retrain the model.
Practical Exercise 3 — Compare Algorithms
Try other classification algorithms:
Logistic Regression
K-Nearest Neighbors
Random Forest
Support Vector Machine
Compare:
Accuracy
Precision
Recall
F1-score
Practical Exercise 4 — Build a Student Prediction Interface
Create a simple application where the user enters:
Study Hours
Attendance
Assignment Score
Previous Exam Score
The application should display:
Predicted Result
Pass Probability
Fail Probability
Practical Exercise 5 — Build a Streamlit Application
Convert the Machine Learning model into a web application using Streamlit.
The user could enter student information through a web interface.
The application could then display:
Student Information
Prediction
Class Probabilities
Model Explanation
Practical Exercise 6 — Add Model Comparison
Create a comparison table:
Algorithm
Accuracy
Precision
Recall
F1-score
This is a useful exercise for understanding model selection.
Common Beginner Mistakes
Mistake 1 — Confusing Classification and Regression
Classification predicts categories.
Regression predicts numerical values.
Mistake 2 — Looking Only at Accuracy
Accuracy may not provide enough information when classes are imbalanced.
Always examine additional metrics.
Mistake 3 — Creating an Extremely Deep Tree
An unrestricted Decision Tree can overfit the training data.
Use parameters such as:
max_depth
min_samples_split
min_samples_leaf
max_leaf_nodes
Mistake 4 — Data Leakage
Never allow information from the target or future outcomes to accidentally enter the feature set.
Data leakage can make a model appear much better during evaluation than it will perform in real use.
Mistake 5 — Assuming Feature Importance Means Causation
Feature importance indicates how the trained model used features.
It does not establish a causal relationship.
Mistake 6 — Treating Synthetic Results as Real-World Evidence
This project is designed for learning.
The 81.25% test accuracy is not evidence that the model would achieve the same performance on real student data.
Important Concept — Overfitting
One of the most important lessons from this project is overfitting.
Imagine a Decision Tree that continues splitting until it perfectly classifies almost every training record.
Training accuracy might become extremely high.
But when the model receives new students, its performance may drop significantly.
This means the model has learned the training data too specifically.
The goal is not:
"Make training accuracy as high as possible."
The goal is:
"Build a model that generalizes reasonably well to unseen data."
Classification vs Regression in Your ML Journey
Your first three projects now create a useful learning progression.
Project #001
Student Score Prediction
Algorithm:
Linear Regression
Problem:
Regression
Project #002
House Price Prediction
Algorithm:
Multiple Linear Regression
Problem:
Regression
Project #003
Student Pass/Fail Prediction
Algorithm:
Decision Tree Classifier
Problem:
Binary Classification
This gives your students exposure to both major Machine Learning problem types before moving into more advanced algorithms.
Portfolio Value
This project demonstrates practical knowledge of:
Python
Pandas
NumPy
Scikit-learn
Supervised Learning
Binary Classification
Decision Trees
Train/Test Split
Accuracy
Confusion Matrix
Precision
Recall
F1-score
Prediction Probabilities
Model Visualization
Model Persistence
GitHub Project Organization
Resume Project Description
You can describe this project on your resume as:
"Developed a Python-based student performance classification system using a Decision Tree Classifier to predict Pass/Fail outcomes from study hours, attendance, assignment performance, and previous exam scores. Evaluated the model using accuracy, confusion matrix, precision, recall, and F1-score, visualized the decision tree, and saved the trained model for reuse."
Interview Questions
What is Machine Learning classification?
What is binary classification?
What is the difference between classification and regression?
What is a Decision Tree?
How does a Decision Tree make predictions?
What is Gini impurity?
What is entropy?
What is the difference between Gini and entropy?
What is overfitting?
How can you reduce Decision Tree overfitting?
What is max_depth?
What is a confusion matrix?
What are True Positive and True Negative?
What are False Positive and False Negative?
What is precision?
What is recall?
What is F1-score?
Why can accuracy be misleading?
What is stratified train/test splitting?
What is feature importance?
Does feature importance prove causation?
What is predict_proba()?
How would you deploy this model?
How would you improve this project?
How would you compare Decision Tree with Random Forest?
Future Enhancements
This project can be extended with:
• Logistic Regression
• Random Forest
• XGBoost
• Hyperparameter tuning
• Cross-validation
• Feature engineering
• Class balancing
• ROC-AUC
• Precision-Recall Curve
• SHAP explainability
• Streamlit deployment
• REST API
• Database integration
• Student performance dashboard
• Model monitoring
GitHub Repository — Download the Complete Source Code
The complete project is available on GitHub:
https://github.com/santhulak/futuretech-ml-student-pass-fail-prediction
The repository contains:
• Python source code
• CSV dataset
• Jupyter Notebook
• Trained Machine Learning model
• Confusion matrix
• Decision Tree visualization
• Requirements file
• Detailed README
Conclusion
Machine Learning Mini Project #003 introduces students to an important new concept:
Classification.
Instead of predicting an exact numerical value, we are predicting a category.
Through this project, you learn the complete classification workflow:
Understand the problem
↓
Explore the dataset
↓
Select features
↓
Split the data
↓
Train the Decision Tree
↓
Make predictions
↓
Evaluate the model
↓
Analyze the confusion matrix
↓
Understand precision, recall and F1-score
↓
Visualize the Decision Tree
↓
Save the trained model
↓
Predict new student outcomes
You have now completed three important stages of your Machine Learning journey:
Project #001 → Regression
Project #002 → Multiple Regression
Project #003 → Classification
The next projects can introduce more classification algorithms and then move toward ensemble learning, clustering, feature engineering, model optimization, and eventually deployment.
Build → Experiment → Analyze → Improve → Deploy
FutureTech Simulation Academy
Don't Just Learn Technology. Simulate the Job.
Complete Source Code:
https://github.com/santhulak/futuretech-ml-student-pass-fail-prediction


Facebook
Instagram
X
LinkedIn
Youtube
WhatsApp